Your devices are ready, but your users are still waiting for the dashboard. For many connected-product teams, building the hardware is only half the job. The web platform that shows live data, sends alerts and controls devices remotely often takes longer than the hardware itself.
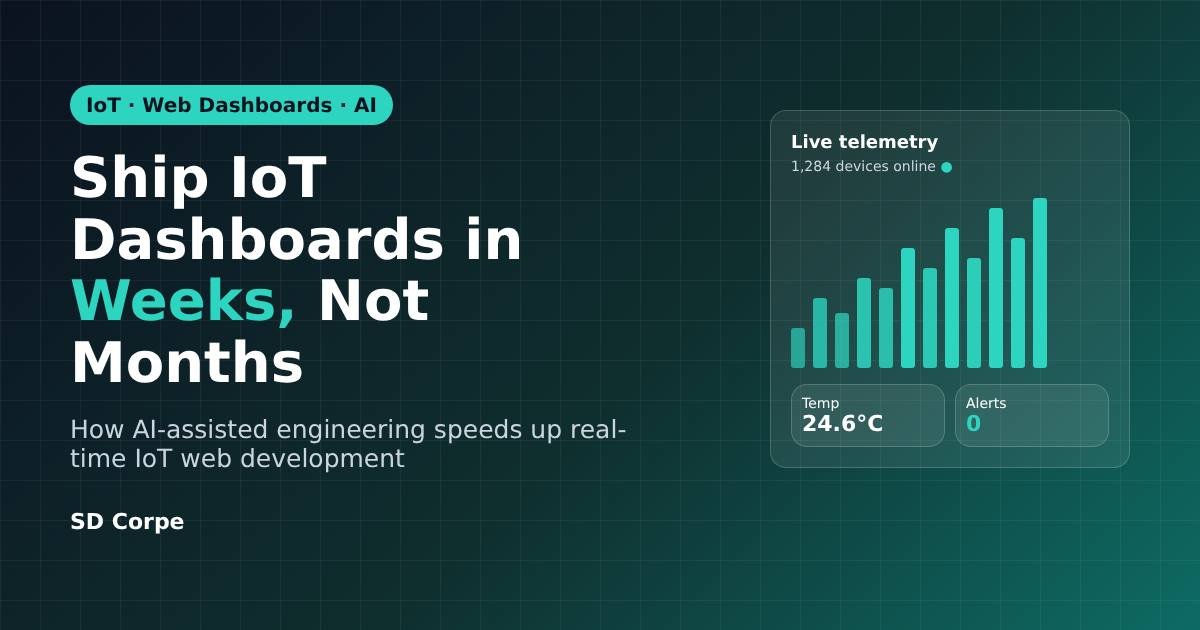
AI-assisted engineering is changing that. By automating the repetitive parts of IoT dashboard development while experienced engineers keep control of architecture and security, teams can take a real-time dashboard from idea to production in weeks instead of months. Delivery time is often cut by half or more.
In this guide, we explain why IoT dashboards take so long to build, the four AI-driven levers that speed them up, what must always stay in human hands, and how this approach applies to real industrial use cases.
Key takeaways
- Traditional IoT web dashboards often take 5–6 months to reach production. An AI-accelerated approach can deliver a production-ready MVP in roughly 6–10 weeks.
- The biggest time savings come from data modelling, device simulation, UI scaffolding and automated testing.
- Software work no longer has to wait for hardware: virtual devices let dashboard development start on day one.
- Security, multi-tenant data isolation and device control stay engineered and reviewed by people. AI never gets the final say.
Why IoT dashboard projects take so long
An IoT dashboard is not a typical website. It has to ingest a constant stream of telemetry, keep thousands of device connections alive, render live charts without freezing the browser, and send commands back to physical equipment safely. Four bottlenecks usually slow projects down:
- Waiting for hardware. Firmware and PCBs are still being finalised, so the web team has nothing real to connect to.
- Manual data modelling. Every sensor payload has to be mapped to database tables, APIs and front-end types by hand, and changed again whenever firmware changes.
- Real-time infrastructure. MQTT brokers, WebSockets, time-series storage and alert engines all need careful setup and tuning.
- Repetitive UI work. Charts, maps, device lists, alert panels and settings screens are built again on almost every project.
The anatomy of a modern IoT dashboard
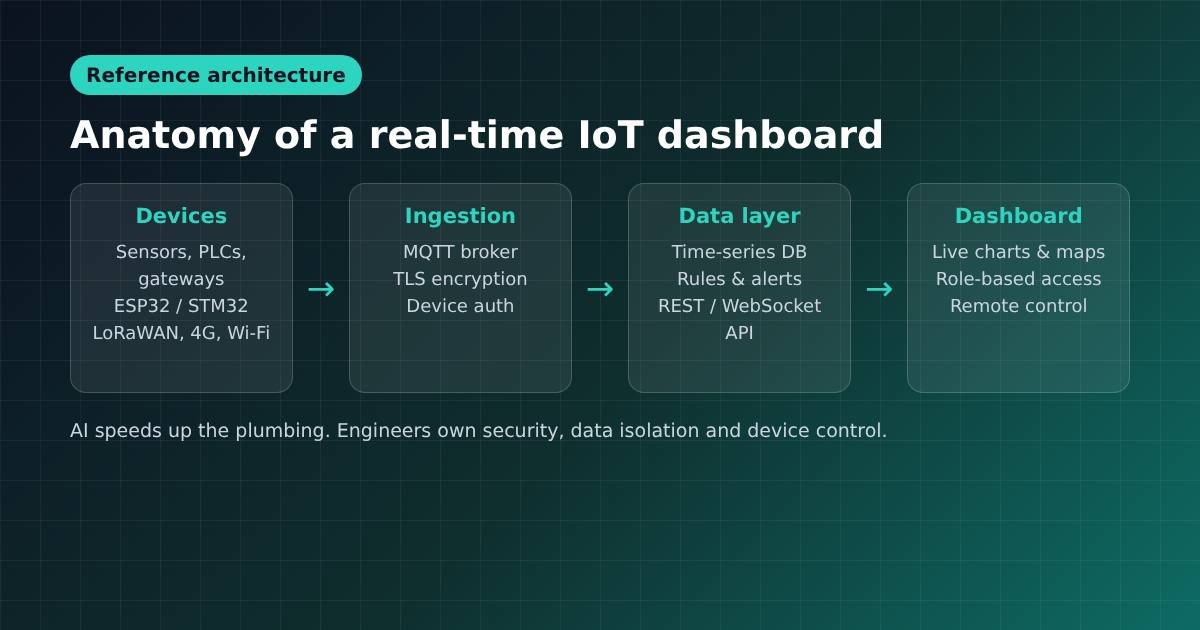
Before looking at where AI helps, it's worth understanding the moving parts. A production IoT platform typically includes:
- Devices and gateways: sensors, PLCs and microcontrollers (such as ESP32 or STM32) connected over Wi-Fi, 4G/LTE, LoRaWAN or Ethernet.
- Ingestion layer: an MQTT broker with TLS encryption and per-device authentication.
- Data layer: a time-series database, a rules and alert engine, and REST/WebSocket APIs.
- Dashboard: live charts, maps, reports, role-based access and remote device control.
Each layer has plenty of predictable, pattern-based work, and that is exactly where AI is most useful.
4 ways AI accelerates IoT dashboard development
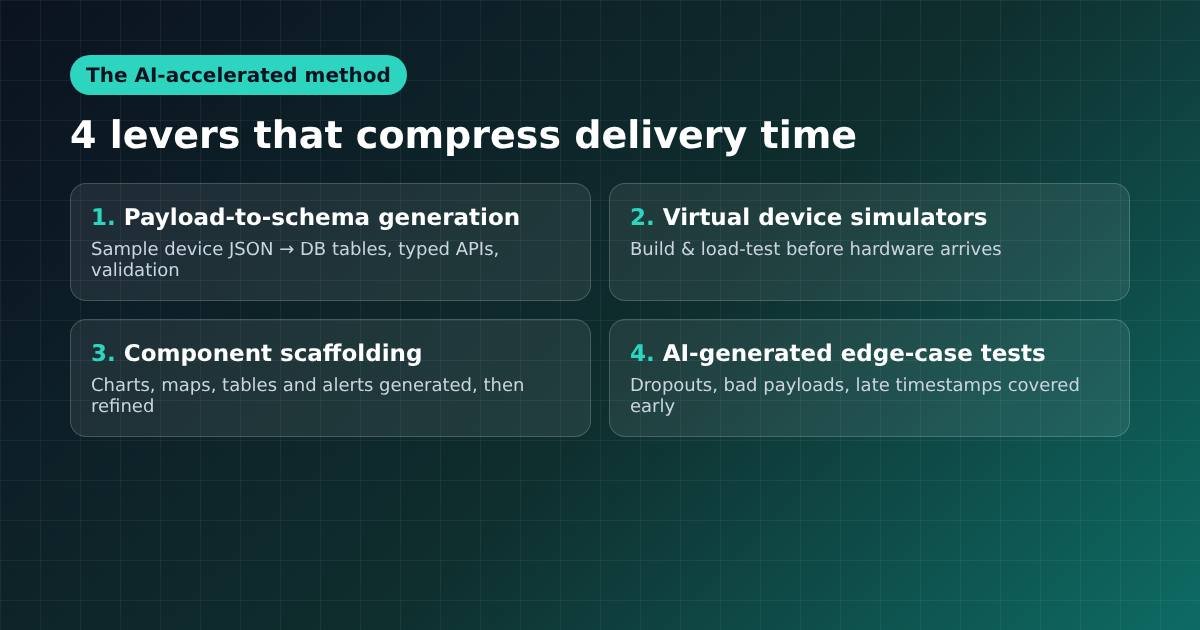
1. From sample payloads to schemas and APIs
Give an AI assistant a few real or sample JSON payloads from your devices, and it can draft the database tables, data validation rules, typed API contracts and front-end interfaces in one pass. Engineers then review and refine instead of writing everything from scratch. Work that used to take a few weeks of back-and-forth can often be finished in a few days. When firmware changes a field, the whole chain can be regenerated quickly.
2. Virtual devices: build before the hardware arrives
AI makes it fast to create realistic device simulators that publish telemetry just like real hardware, including noise, drift, dropouts and alarm conditions. That means:
- Dashboard development starts on day one, in parallel with firmware.
- Teams can load-test with thousands of virtual devices before launch.
- Product owners see a working demo early and can give feedback while changes are still cheap.
3. Faster UI scaffolding for data-heavy screens
Most IoT dashboards share common building blocks: time-series charts, gauges, fleet maps, device tables, alert feeds and configuration forms. AI generates these components quickly from a description or a design, and developers focus on performance (for example, Canvas or WebGL rendering for large datasets) and on making the experience feel polished and on-brand.
4. AI-generated edge-case testing
Real-world IoT data is messy. AI helps write tests for the scenarios that break dashboards in production: network outages, corrupted payloads, duplicate messages, out-of-order timestamps and sudden traffic spikes. Wider test coverage, written earlier, means fewer surprises after go-live.
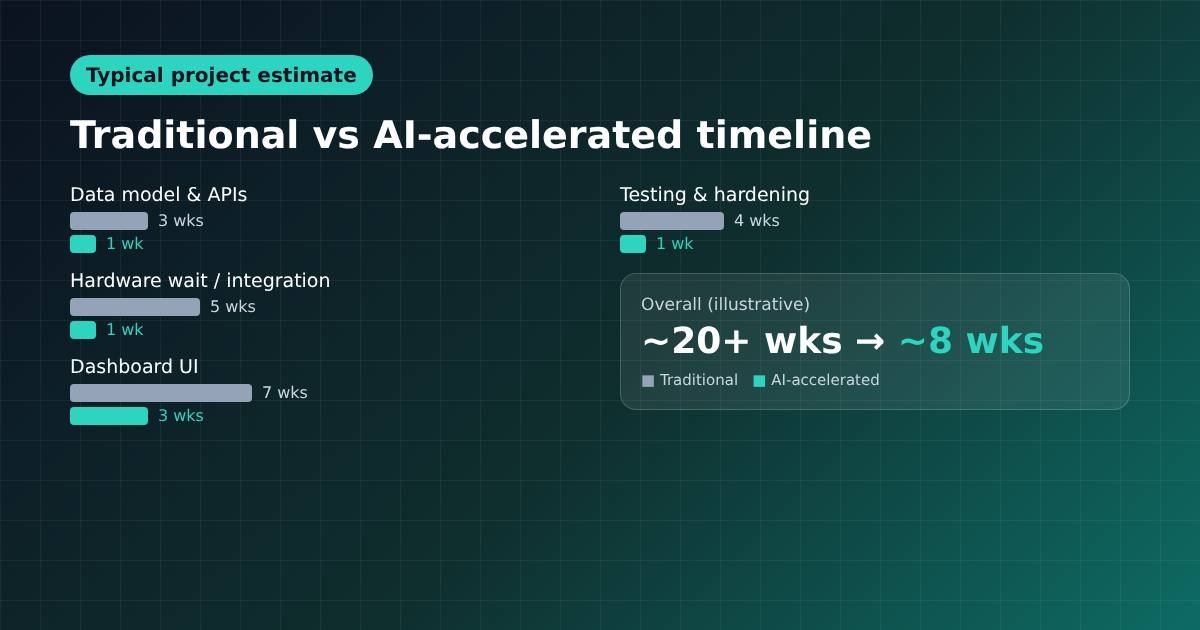
Traditional vs AI-accelerated: a typical timeline
Every project is different, but here's an illustrative comparison for a mid-sized industrial dashboard:
- Data modelling & APIs: ~3 weeks → ~1 week
- Hardware waiting & integration: ~5 weeks → ~1 week (thanks to simulators)
- Dashboard UI: ~7 weeks → ~3 weeks
- Testing & hardening: ~4 weeks → ~1 week
Together with planning and deployment, that is the difference between a project of 20+ weeks and one of around 8 weeks: more than 50% faster time to market.
AI speeds up the plumbing. Engineers own security, data isolation and device control.
What should never be left to AI
Speed is worthless if the platform isn't secure. Some parts of an IoT system have to be designed, implemented and reviewed by experienced engineers:
- Authentication and device identity: TLS 1.2/1.3, per-device credentials or certificates, and zero-trust access rules.
- Multi-tenant data isolation: customer A must never see customer B's data, enforced at the database and API level.
- Remote actuation safety: commands that switch pumps, motors or valves need permissions, confirmations, signed messages and full audit logs.
- Compliance and best practice: alignment with guidance such as the OWASP IoT Top 10.
In an AI-accelerated workflow, every AI-generated piece of code is reviewed and tested by an engineer before it reaches production.
Real-world use cases
Industrial predictive maintenance
Vibration, temperature and current sensors on motors and compressors stream data to a dashboard that spots unusual patterns and raises alerts before a breakdown, reducing unplanned downtime.
Water, energy and environmental monitoring
Remote pump stations, solar installations, tank levels and flood sensors, often on LoRaWAN or cellular networks, report to a central SCADA-style dashboard with maps, thresholds and SMS or email alerts.
Fleet and asset tracking
GPS trackers and condition sensors give live location, route history, geofencing and cold-chain temperature logs in one place.
Smart buildings and home automation
Energy meters, HVAC, lighting and access control are monitored and controlled from a single web or mobile dashboard.
How to get started
- Define your data: list your devices, the values they send and how often.
- Prioritise the screens: what do operators, managers and customers each need to see?
- Start with simulation: build against virtual devices while hardware is finalised.
- Ship an MVP fast, then iterate with real user feedback.
- Partner with a team that understands hardware, firmware and web, so nothing gets lost between layers.
Want to know more about how AI is changing development in general? Read our guide: How AI Helps in Software Development.
Frequently asked questions
How long does it take to build an IoT dashboard?
A traditional custom IoT dashboard often takes 5–6 months. With AI-assisted engineering and device simulation, a production-ready MVP can typically be delivered in about 6–10 weeks, depending on scope and integrations.
Can dashboard development start before the hardware is ready?
Yes. Virtual device simulators publish realistic data, so the web platform can be built and tested in parallel with hardware and firmware development.
Is AI-generated code secure enough for IoT?
Only when it's reviewed. AI speeds up routine code, but authentication, data isolation and device control should always be designed and verified by experienced engineers.
What technology stack is used for IoT dashboards?
A common stack includes an MQTT broker (such as Mosquitto or EMQX), a time-series database (such as TimescaleDB or InfluxDB), a backend API with WebSockets, and a modern web front end such as React or Vue.
How many devices can an IoT dashboard handle?
With the right architecture, from a handful of prototypes to tens of thousands of devices. Load testing with simulated devices before launch shows how the platform will perform at scale.
Build your IoT dashboard with SD Corpe
At SD Corpe, we design and build complete IoT products: hardware, embedded firmware, cloud and web dashboards, all under one roof. Our AI-accelerated engineering process helps you launch faster without compromising on security or quality.
Planning a connected product or stuck waiting on a dashboard? Contact our team today for a free consultation, and let's get your IoT platform live in weeks, not months.